


 5 Reasons Why Your Business Needs a Mobile eCommerce Application
 Using Salesforce to Improve Your Sales Pipeline: Five Tips
 Cross-Platform Mobile Development: Five Best Frameworks
 How to Develop Custom Accounting Software
 10 Best Web Development Frameworks in 2024
Learning of possible software aberrations as soon as possible, so that you can resolve them before you find yourself buried under a mountain of complaints, or even worse — to discover that users have switched to robust competitor solutions, is a must in your business. In this article, we will provide an overview of a Microsoft solution that allows engineers and developers to stay up-to-date on software performance — Azure Application Insights. Our .NET development experts got to know the ins and outs of this service and are ready to share its features and capabilities.
Drive your digital transformation to the next level with our world-class cloud development services
Application Insights: Why the Need for Performance Monitoring
Gartner’s Magic Quadrants for Application Performance Monitoring demonstrate that keeping track of the state of IT landscapes is becoming a hot topic: an increasing number of companies provides software of this type.
Figure 1. 2019 Magic Quadrant for Application Performance Monitoring
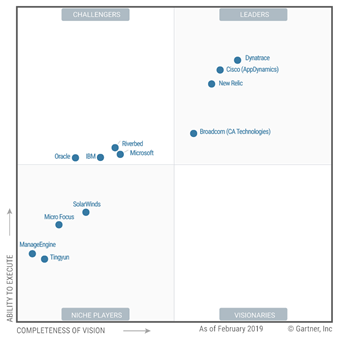
Source: Gartner
Why should we opt for a solution such as Azure Application Insights? Let’s explore performance monitoring software through the example of this extensible service for Application Performance Management.
Application Insights: The Purpose
What is Application Insights? As with a lot of other similar solutions, the general idea is the facilitation of software health monitoring. Created to help web developers, the solution keeps track of application performance and diagnoses abnormalities in its condition and behavior.
App Insights’ collection and processing of usage data relies on powerful analytical capabilities. Using various performance measures, user events and log counters, the service handles user insights so that maintenance personnel can understand user behavior within the application and monitor its condition.
What’s especially convenient about the service is that it can be used seamlessly as part of DevOps-based processes. Created by Microsoft, it extends beyond ASP.NET applications and also supports Java, IOS, Node.js, JavaScript and Java EE SDKs.
So, the robust operation of an application monitoring solution significantly contributes to being able to address issues timely, the recipe for continuous performance and usability improvement.
Application Insights: Capabilities
By default, App Insights starts collecting certain metrics immediately after proper setup and configuration. The solution performs the following activities:
- Continuous monitoring: the tool collects performance statistics from the Windows performance counter and sends it to the portal.
- Custom alert configuration.
- Availability testing — in the form of URL-based ping and web-based tests.
- Data visualization for a visual representation of various data, including that of user flows.
- Tracking and logging of user sessions: the function enables the analysis of the user journey, which contributes to a better understanding of the application’s pain points.
- Smart detection — a recommendation functionality that is powered by machine learning algorithms.
- Performance testing based on web tests.
- Application map that visualizes system components, such as the server, the database and other resources.
- Snapshot debugger — a component that saves code status at the time of an exception for further check.
From all of this rich functionality, the only thing that we find excessive is CodedUI-based performance testing, as there is a wide range of solutions such as JMeter that are purpose-built.
Read also: Migrating to Azure: Best Practices
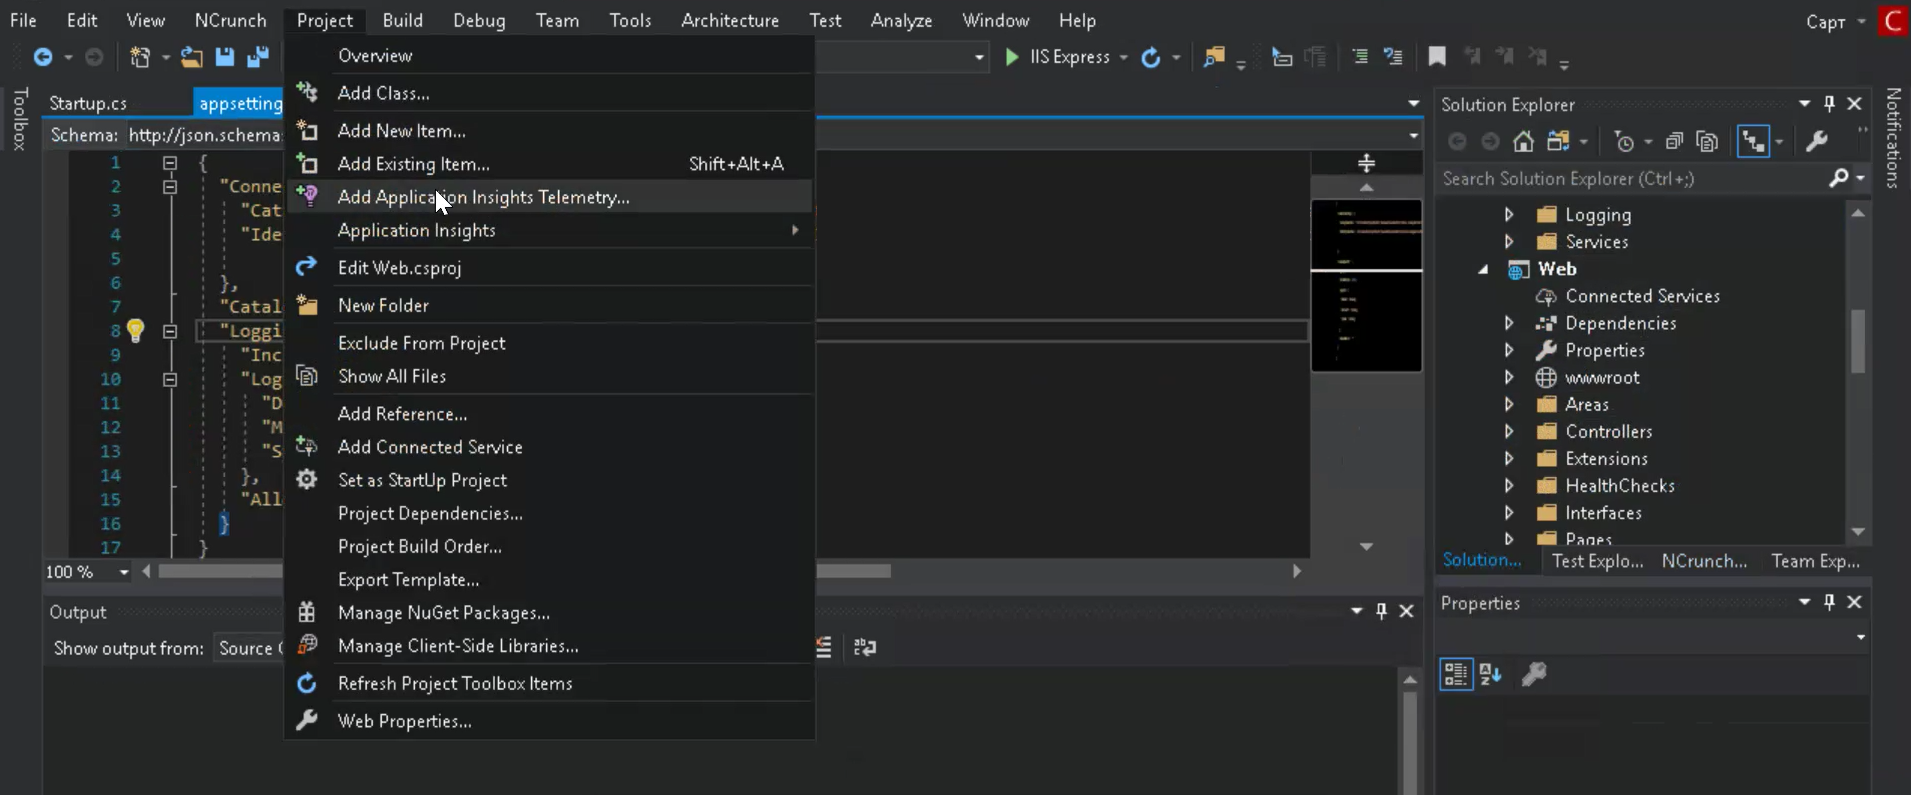
Application Insights: How It Works
Below, there is a sort of an online tour of Azure Application Insights’ capabilities fused with a step-by-step guide to its use that we have illustrated with screenshots. For better understanding, we will demonstrate the solution’s operation through the example that we will refer to as Application Insight Training.
Work Initiation
To start working with the solution, a user has to log in and download Application Insights SDK. Let’s take a look at the portal and its contents.
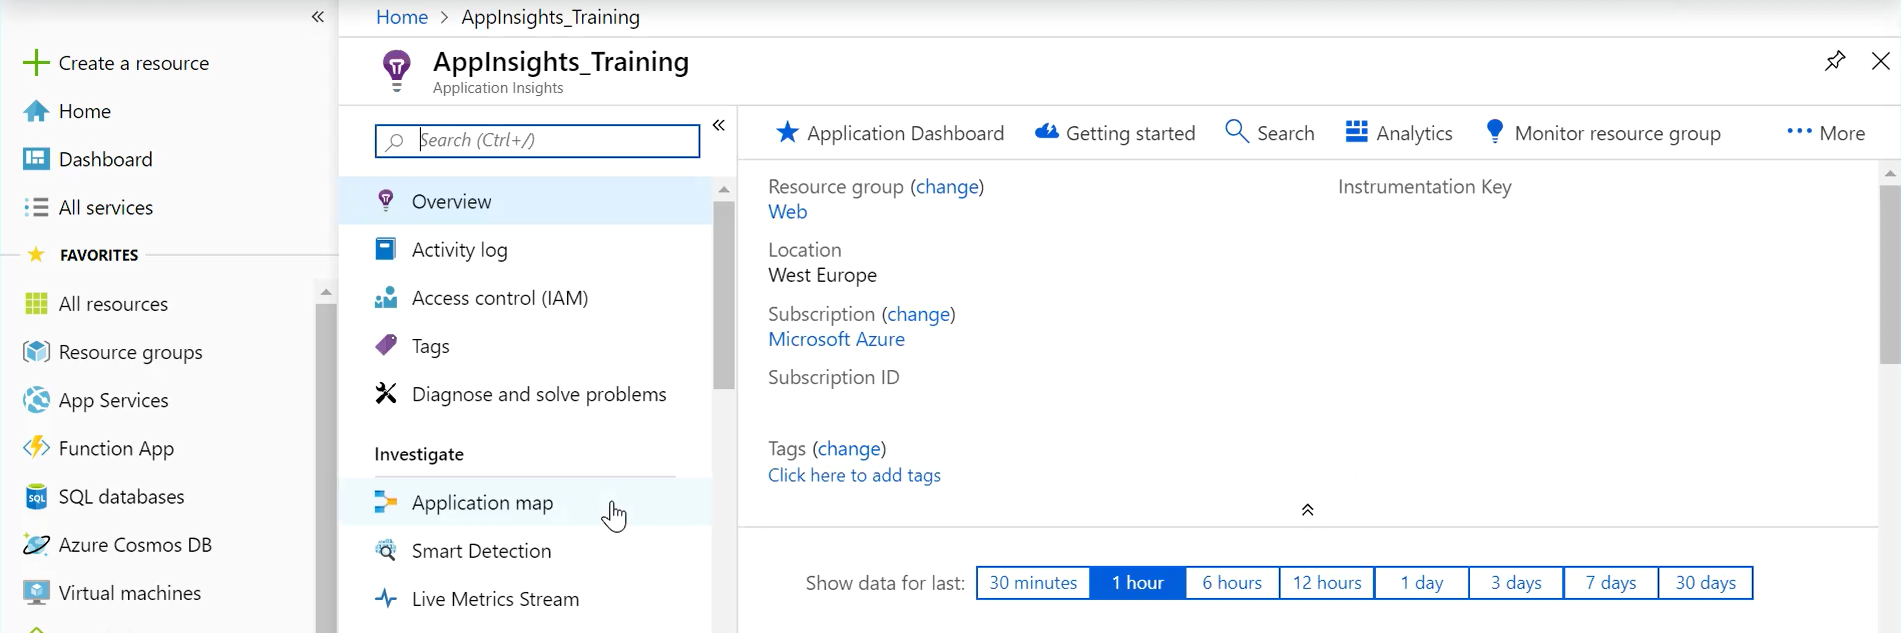
The portal provides several resource groups. In this case, we use the ApplicationInsight_Training resource group.
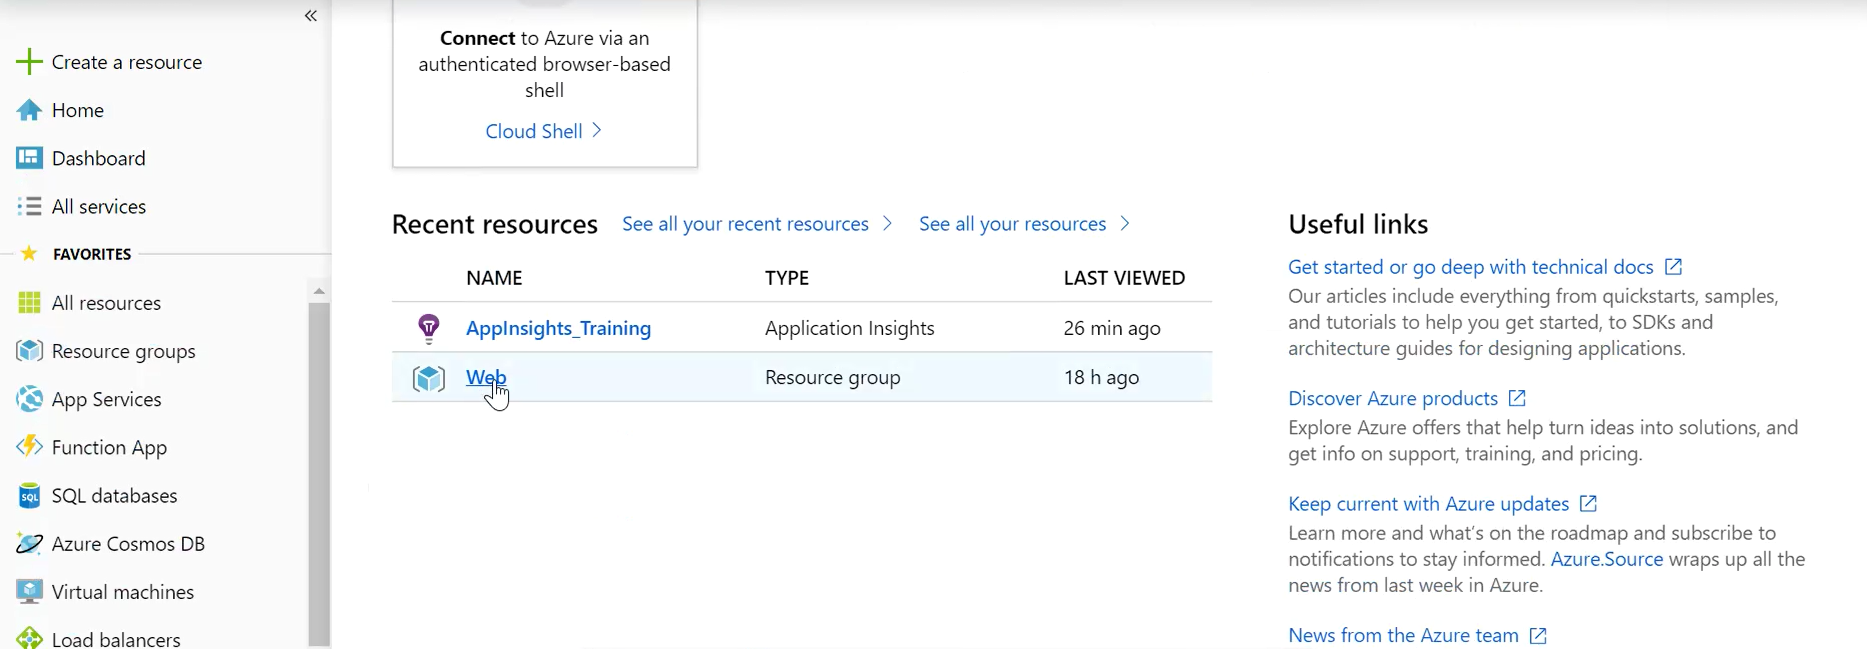
A resource group enables the creation of a number of resources that are basically containers. An identification key specifies a corresponding container for data sending.
In Application Insight Training, we create a separate container for each specific environment — one each for development, test, staging and production. In general, Application Insights enables all of the web services to code into the same container, which is why several containers separate data. For our project, we keep all system logs in one place.

Capabilities Overview
By default, the container’s Overview page settings are an easily customizable dashboard that provides an overview of the main application parameters: the number of requests, response time and application availability.
Activity log illustrates app events that took place in the source group over a specific period of time.
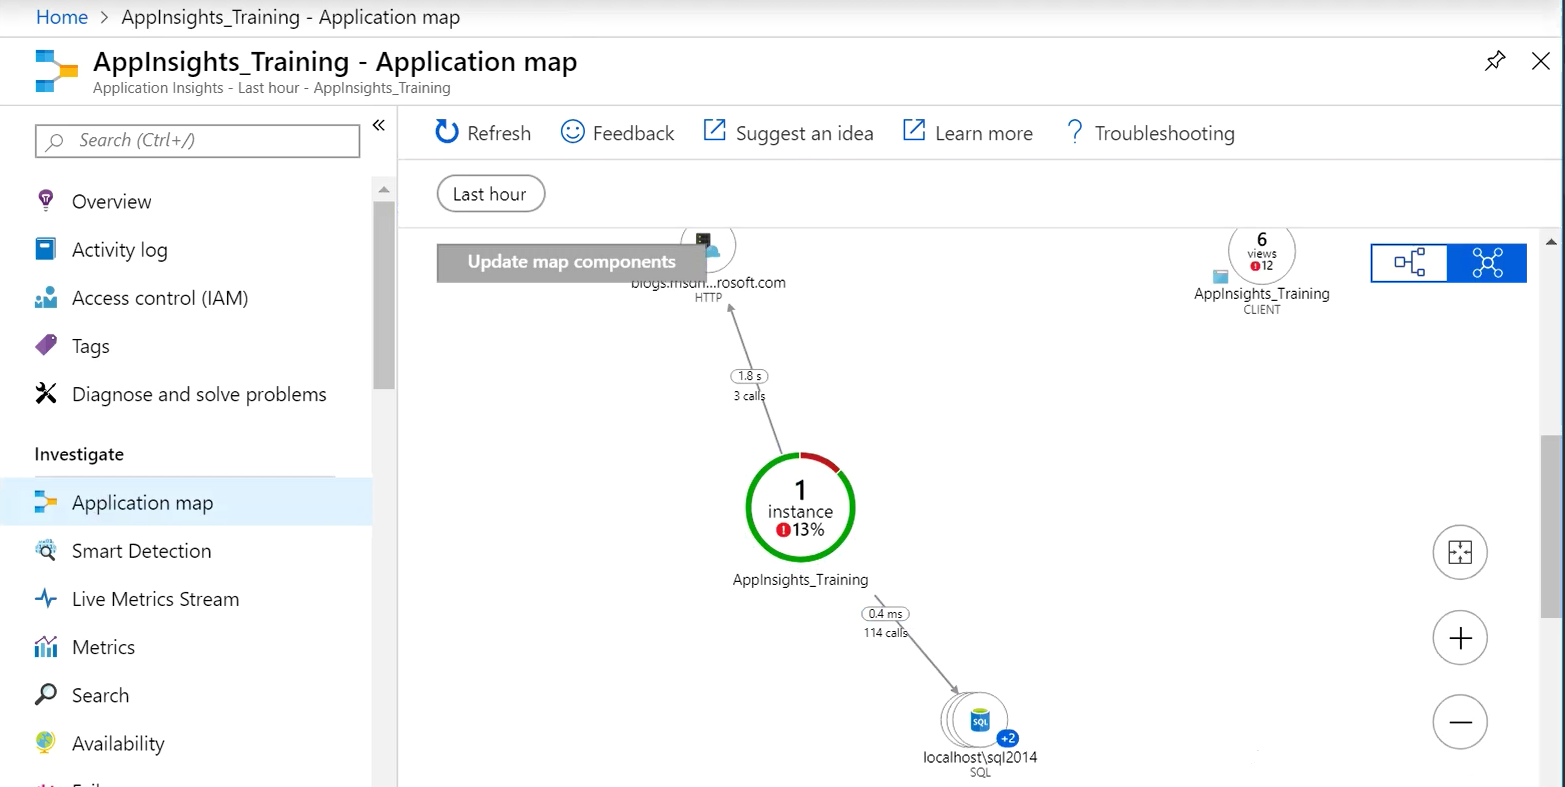
Application map is a high-level overview of system components that showcases instances and the duration time. It demonstrates the use of app components, with key metrics and alerts, and collects statistics on request duration.
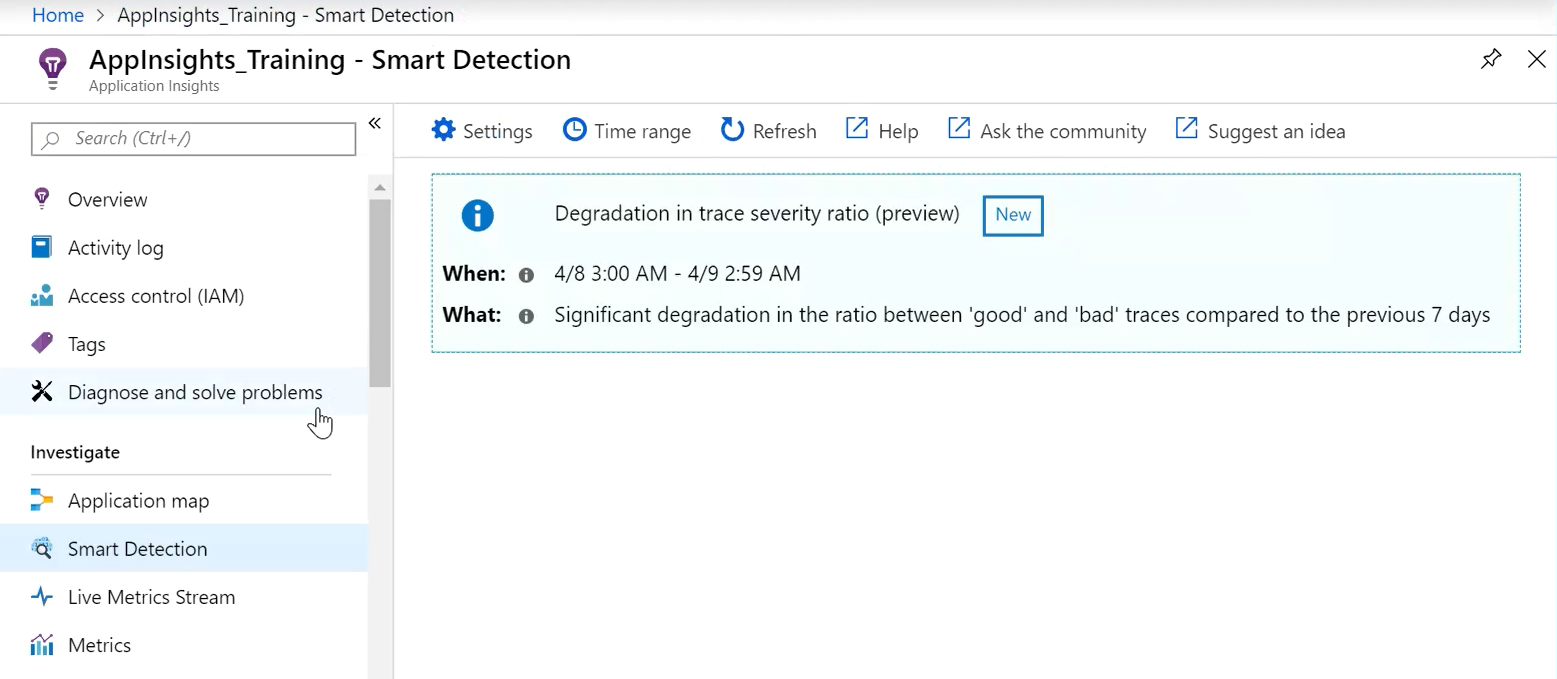
The Smart detection functionality analyses the application’s performance and makes recommendations based on previous metrics.
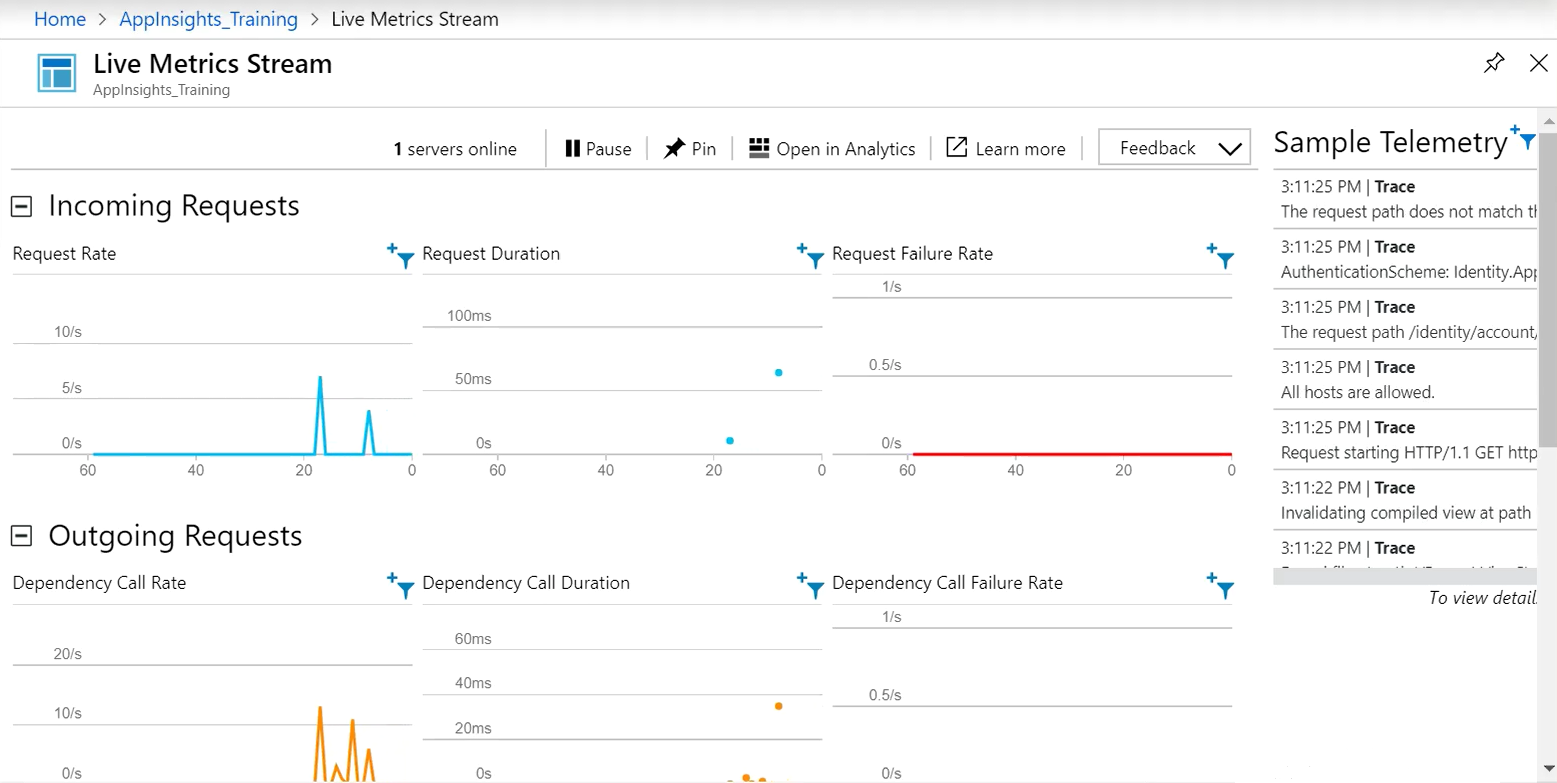
Live Metrics Stream is a component that allows users to have an overview of the system performance in real time. This capability is especially useful after the deployment, as it showcases the post-deployment server reaction. It is probably most useful for shutdown-proof systems that are robust 24/7.
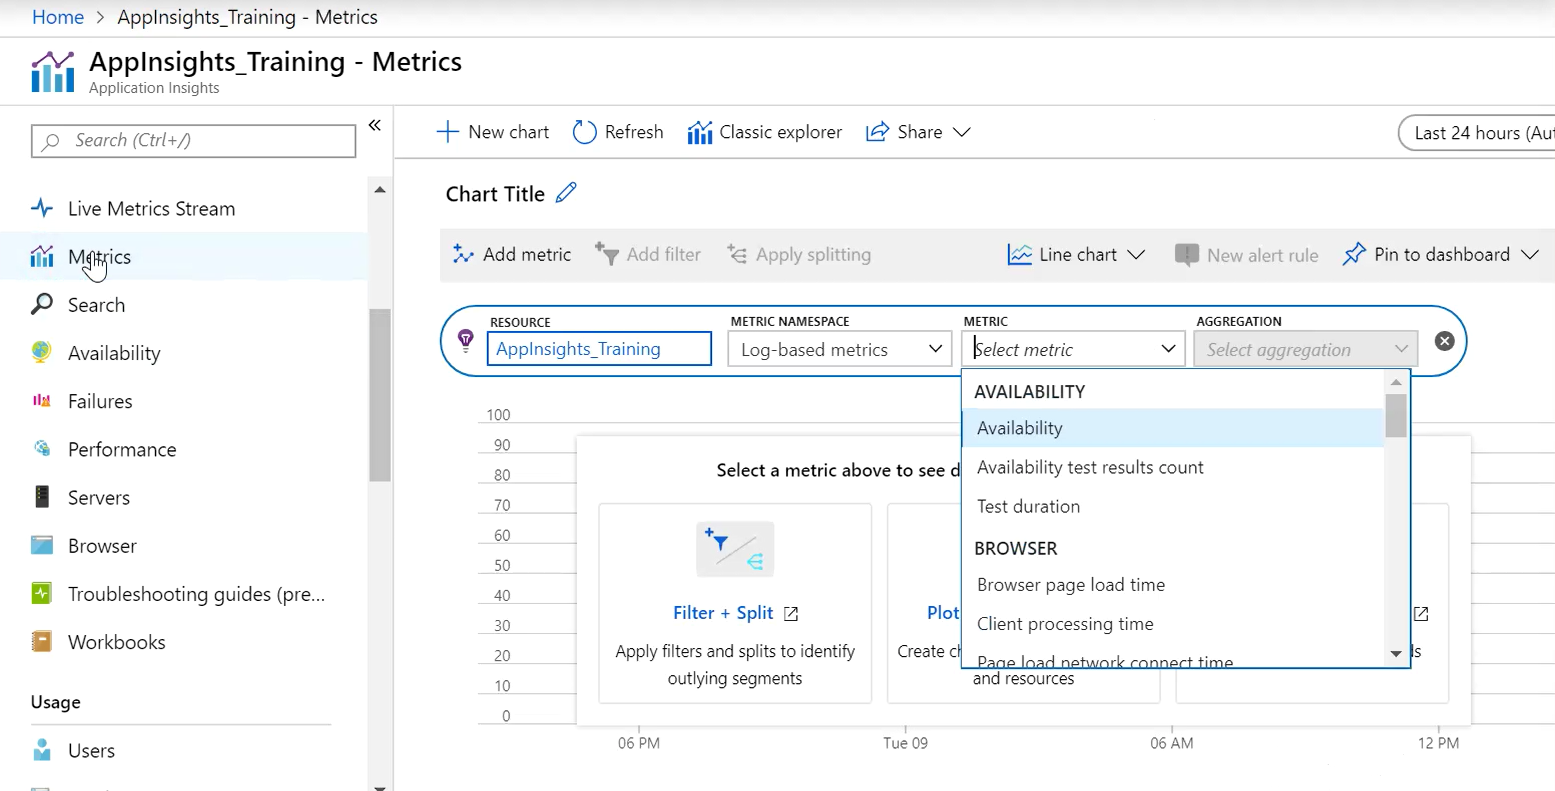
The Metrics tab provides certain system data that can be filtered. Also, it enables alert-creating and metrics-rendering as a dashboard.
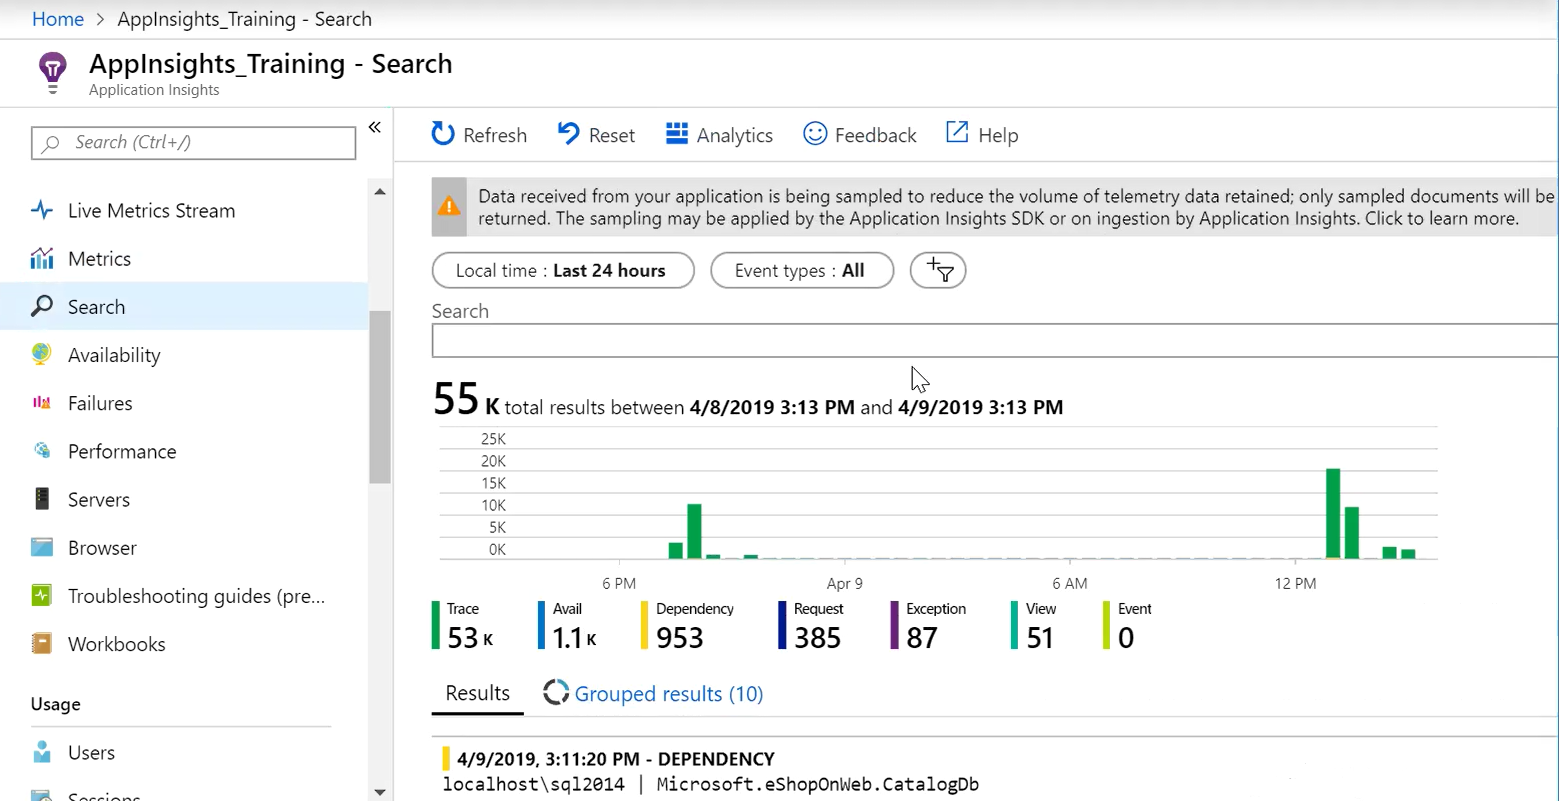
Search is probably one of the most useful components. It provides all the data that can be visualized: logs, requests, exceptions, traces, availability, dependency and other metrics collected for a specific period of time.
By default, Application Insights collects logs according to an operation that involves all data generated by request. For example, we choose a request and check events that have taken place, including the text of SQL queries. However, potentially, it may cause the leak of credentials, be careful!
The analytics button enables the creation of complex queries and allows users to get the table- and dashboard-type result representation.
The Availability component speaks for itself: it shows system availability. It enables URL ping tests and multi-step web tests, which can be useful for the general availability check based on the login process or other complex user steps. Also, it enables configuring test locations, alerts and notification groups.

The Failures tab provides a structured representation of the recent malfunctions.
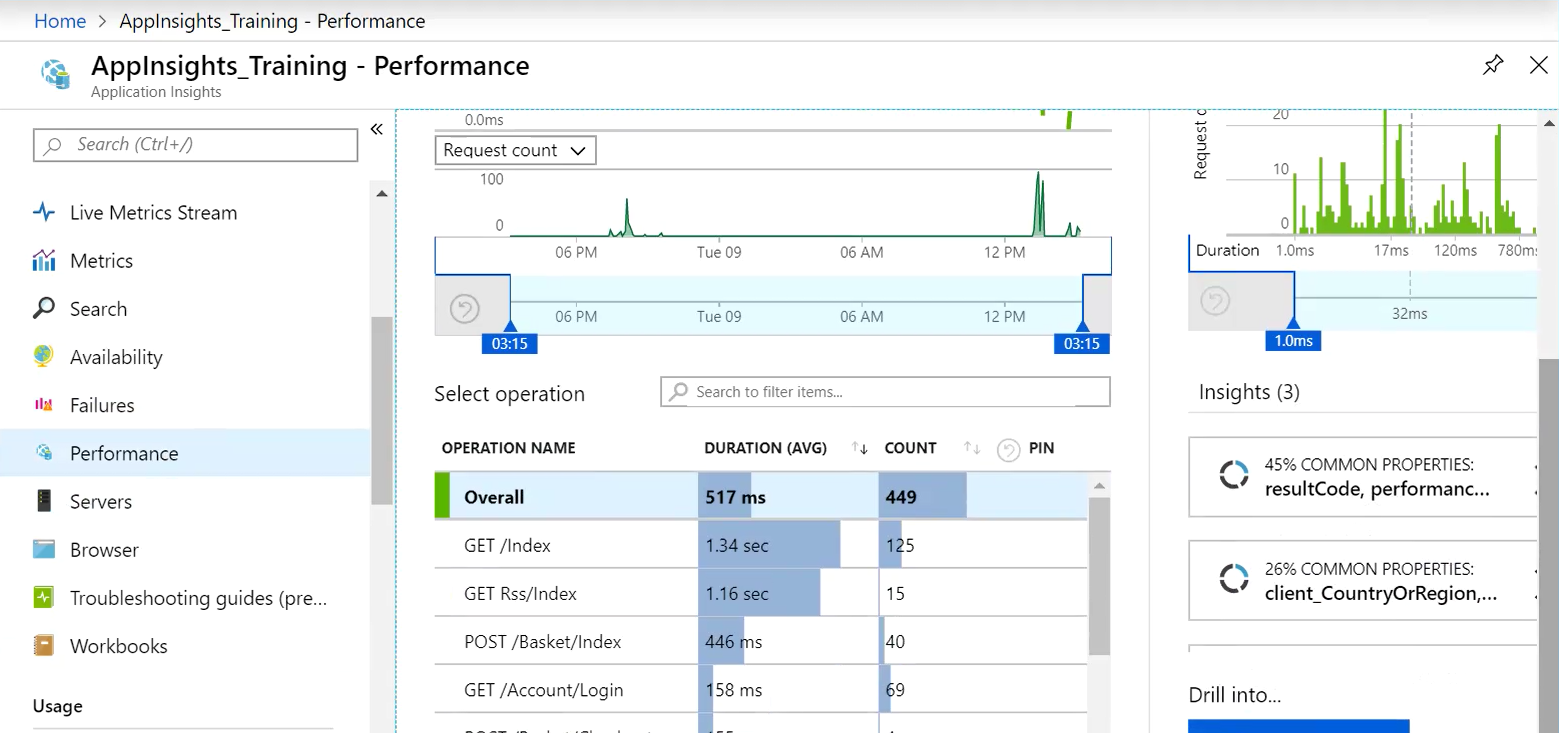
The Performance tab contains key operation parameters. The most useful ones are likely on the list below the dashboards: there is data on request duration. If filtered by the number of requests (count), it provides information on how much time every specific request takes. Based on that, technicians can identify bottlenecks and improve the request time to enhance user experience.
User, sessions and user flows tabs provide basic information on user location, browsers, operating systems, which may be useful for load tests.
The Alerts tab enables setting rules for system notification about any specified conditions. The rules can rely on web tests, URL ping and on custom events or conditions, for example, logins from different regions, such as the US and Bahrain, within a short time, or any other suspicious activities.
And, finally, the Application Insights Analytics tab provides table-view information on the information it stores. Also, it enables chart building based on queries. The component provides data with a delay that we estimate at 30 seconds, though the vendor states it to be approximately five minutes.

Module Performance: Room for Improvement
By default, Application Insights adds 27 initializers. However, they can be managed only at the startup, as their further modification is impossible without coding. Also, there are difficulties with the renaming and displacement of a configuration file, as its name is built into the SDK.
Another observation is as follows: Microsoft recommends adding initializers and processors to configuration files, but it works out only if no injection into the class constructor is required. Otherwise, it is initialized, blows up during the startup and then operates normally.
Practical Tips to Enhance Your Project’s Performance
As with any other solution, the out-of-the-box capabilities of Application Insights can be significantly extended. Moreover, there are some tricks that may help improve the performance of the service. Let’s dive into the recommendations of our experts.
Application Insights Extensibility
The core package — Microsoft.ApplicationInsights — provides the API that enables sending telemetry to the solution for processing. At the same time, Application Insights can be extended with custom initializers and modules so that it collects additional data that is required for a specific project. What it takes is proper configuring.
Telemetry Channel
The telemetry channel is in charge of user data buffering and sending. There are two types of channels:
- In-memory channel. This channel buffers data in memory and is used by default for services.
- Server channel. It manages the offline mode by keeping data in persistent storage and sending it when the application is connected to the internet. Also, one can specify the URL and the destination path for data transmitting and saving, if it’s required not to send data directly to Application Insights.
Telemetry Initializer
Telemetry initializers set properties for the application’s context that accompany any telemetry item. However, the component enables custom creating of initializers to set specific context properties.
There is a wide variety of initializers, and all of them are designed for a specific purpose: the setting and updating of each of the properties.
Telemetry Processor
The telemetry processing tool enables item modification right before it is sent to the portal from the SDK. There are the following types of telemetry processors:
- Adaptive sampling telemetry processor. Set by default, it can remove some of your application’s telemetry.
- Fixed-rate sampling telemetry processor. It reduces the traffic that comes from the web browsers and the web server at a specified rate.
Performance Collector
The tool collects the counters of system performance, such as CPU, memory and others. It allows for extending the range of counters that are provided by default by installing additional ones when required.
Addressing the Lack of Data
After GDPR has entered into force, Microsoft stopped providing IP addresses to Application Insights. However, the issue can be bypassed by creating a custom TelemetryProcessor or TelemetryInitializer.
Also, we would recommend adding custom fields that help distinguish system components and the current username and ID. Naturally, it may result in a huge amount of data, which can be addressed via the prepopulation. Another useful provision is a custom field for the build version, which improves error analysis while upgrading.
Logger Integration
Application Insights provides an efficient integration with various log providers, from a standard Microsoft default logger to NLog and Serilog. We encourage sending logs to Application Insight s for the following reasons:
- It provides a more convenient search.
- It eliminates the need to create additional storage as a database, which may cause problems related to its support, volume and other.
- Alert setup is based on a specified condition, exceptions, etc.
We develop innovative cloud-based solutions for clients around the world
Application Insights: To Be or Not to Be
While there is a variety of similar solutions for performance monitoring, choosing Application Insights depends on your specific IT environment and its requirements. That said, we find it to be quite a useful tool, as it can significantly contribute to a more comprehensive overview of the application’s performance.
Which solution you choose is up to you. But regardless of your choice, make sure that your applications perform robustly and efficiently to provide the best possible user experience.
A Microsoft Gold partner, SaM Solutions has an extensive experience in enhancing project performance with .NET-based solutions. Contact our experts to make the most use of your IT landscape with robust solutions that provide a positive user experience and improve business efficiency.

A content writer at SaM Solutions, Yuliya is anxious to create and deliver relevant experiences. She evangelizes corporate knowledge on expertise and innovations that the company provides.


![[Tech Talk] What Developers Should Know About SQL Optimization, Part 1: Fundamentals](https://www.sam-solutions.com/blog/wp-content/uploads/fly-images/30279/SQL-video-cover-370x238.webp)


 Top 30 Ecommerce Tools to Elevate Your Business in 2024
 5 Best Tools to Improve Embedded Software Testing
 Why React and Node.js Are the Top Technologies for Creating High-Performance Web Apps in 2024
 10 Best IoT Platforms for 2024
Its like you read my mind! You appear to know a lot about this, like you wrote the book in it or something. I think that you could do with some pics to drive the message home a bit, but other than that, this is magnificent blog. A great read.
I will definitely be back.
Thanks on your marvelous posting! I definitely enjoyed reading it, you’re a great author. I will remember to bookmark your blog and will come back later in life.
If you want to take much from this piece of writing then you have to apply such techniques to your own website.